> ## Documentation Index
> Fetch the complete documentation index at: https://docs.cloudeval.ai/llms.txt
> Use this file to discover all available pages before exploring further.
# Reports
> Understand the Cloud Evaluation report structure, report payloads, evidence model, exports, and review workflows.
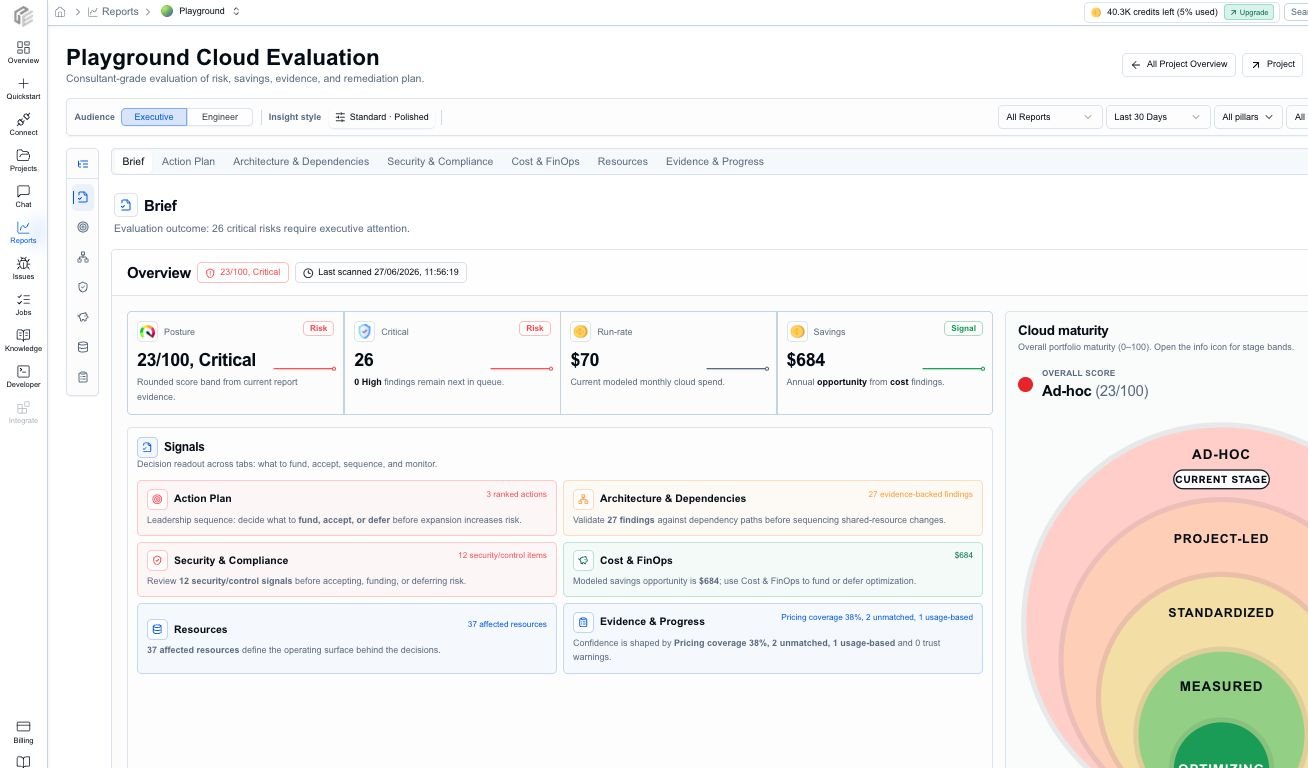
Reports are where CloudEval shifts from infrastructure inspection to decision support. The main product surface is the **Cloud Evaluation report**: a project-aware report that brings posture, priority actions, architecture, security, cost, resources, evidence, and progress into one review flow.
For the current count of checks and signals behind report outputs, see [Evaluation coverage](/reference/evaluation-coverage).
## Report anatomy
The report is organized around the decisions a team needs to make, not only the raw report payload that produced each metric.
| Area | What it answers | Typical details |
| --------------------------- | --------------------------------------------------------------------------------------- | ----------------------------------------------------------------------------------------------------------------------------------- |
| Brief | Is this project healthy enough to review, share, or ship? | Posture score, critical count, run rate, savings, maturity, freshness, confidence, assumptions, and stakeholder summary. |
| Action Plan | What should the team do first? | Ranked findings, severity, owner, effort, target date, confidence, business impact, suggested action, and drilldown controls. |
| Architecture & Dependencies | Where does the design create reliability, operational, performance, or dependency risk? | Well-Architected pillar signals, dependency context, architecture graph references, affected resources, and design recommendations. |
| Security & Compliance | Which security and compliance signals need review? | Security-themed findings, control context, confidence, evidence links, source references, and remediation guidance. |
| Cost & FinOps | What is the cost exposure and where are the useful optimization levers? | Monthly run rate, annualized context, savings opportunities, service families, cost assumptions, and unmatched pricing notes. |
| Resources | Which resources need attention? | Inventory rows with resource identity, status, severity, issue count, cost context, savings, evidence links, and primary action. |
| Evidence & Progress | Can the team trust the report and see what changed? | Source artifacts, warnings, assumptions, evidence links, freshness, trend snapshots, and report history where available. |
## Priority decisions
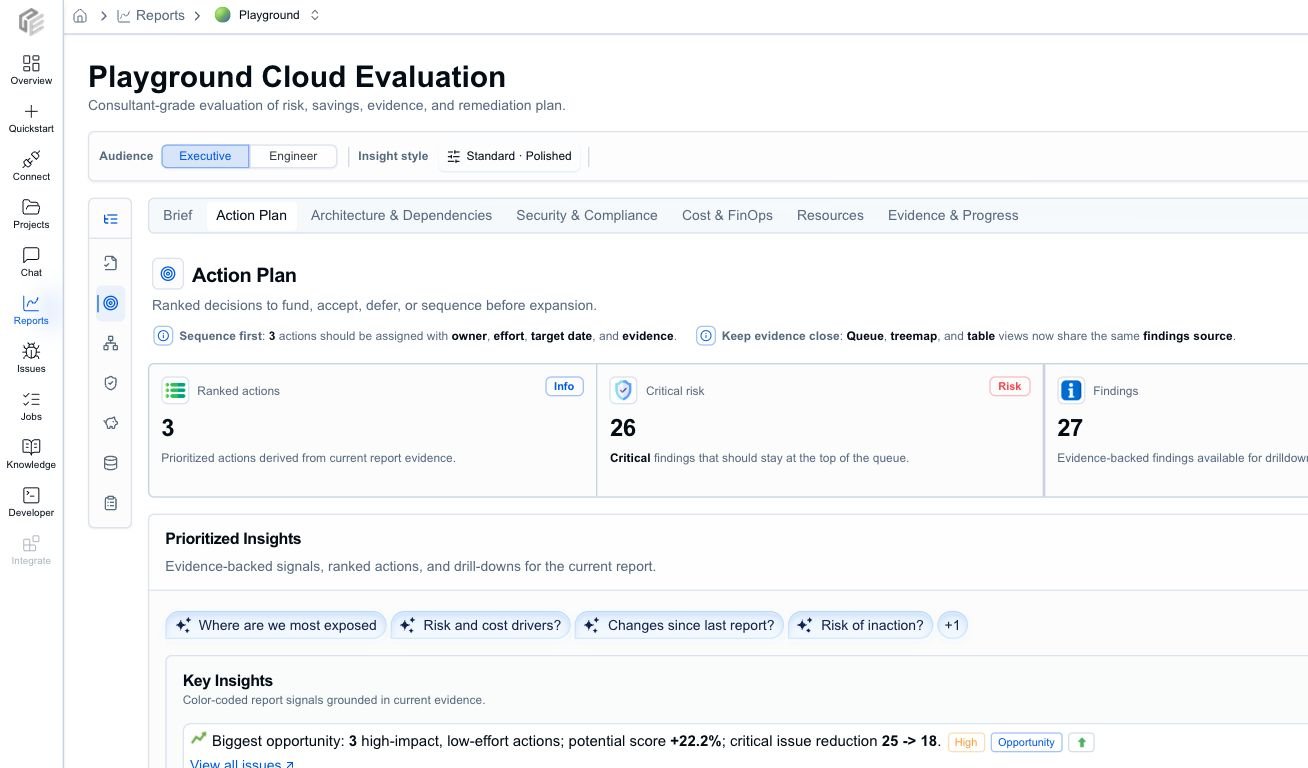
The first review pass should start with the issues that have the clearest severity, confidence, business impact, ROI, or effort signal. CloudEval keeps those signals together so the report is not just a long findings export.
Use the Action Plan when you need to:
* decide which issues block rollout
* separate urgent remediation from backlog work
* compare severity against savings and effort
* assign owners and target dates
* open a finding detail view without losing report context
## Breakdown views
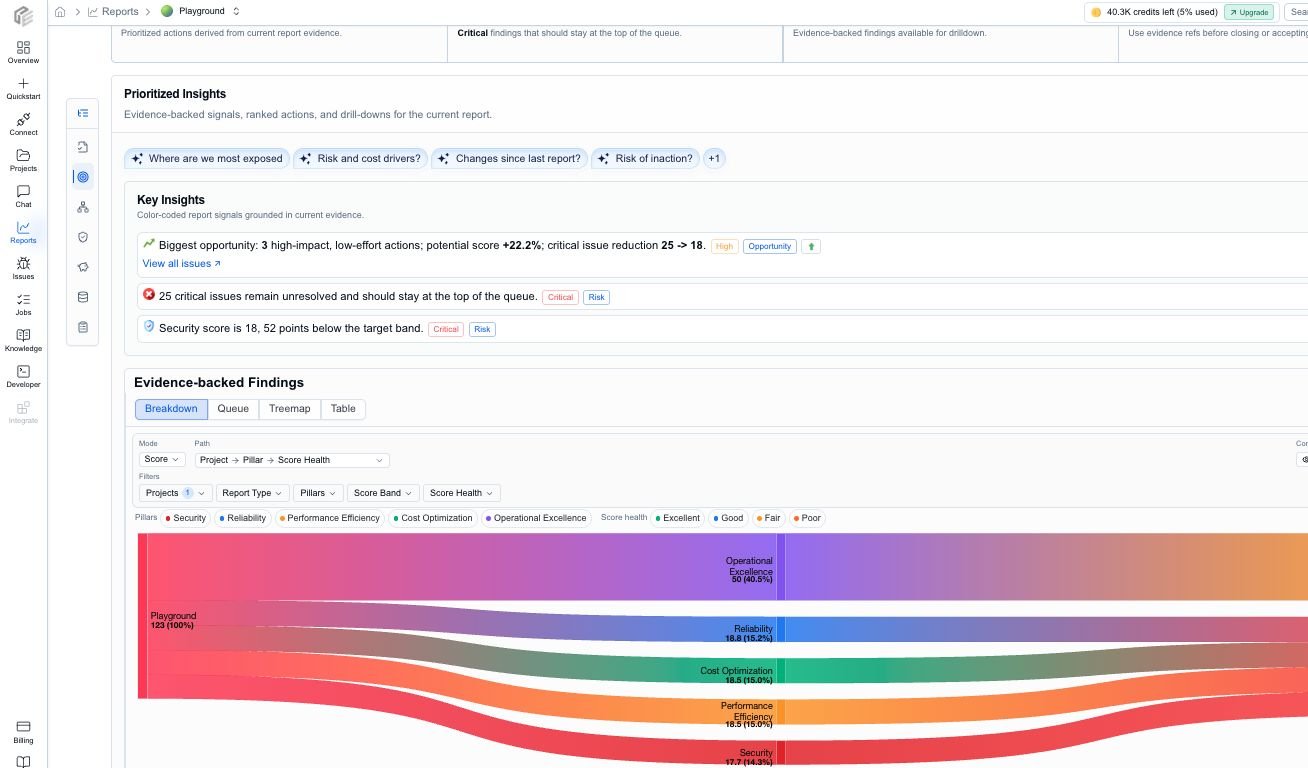
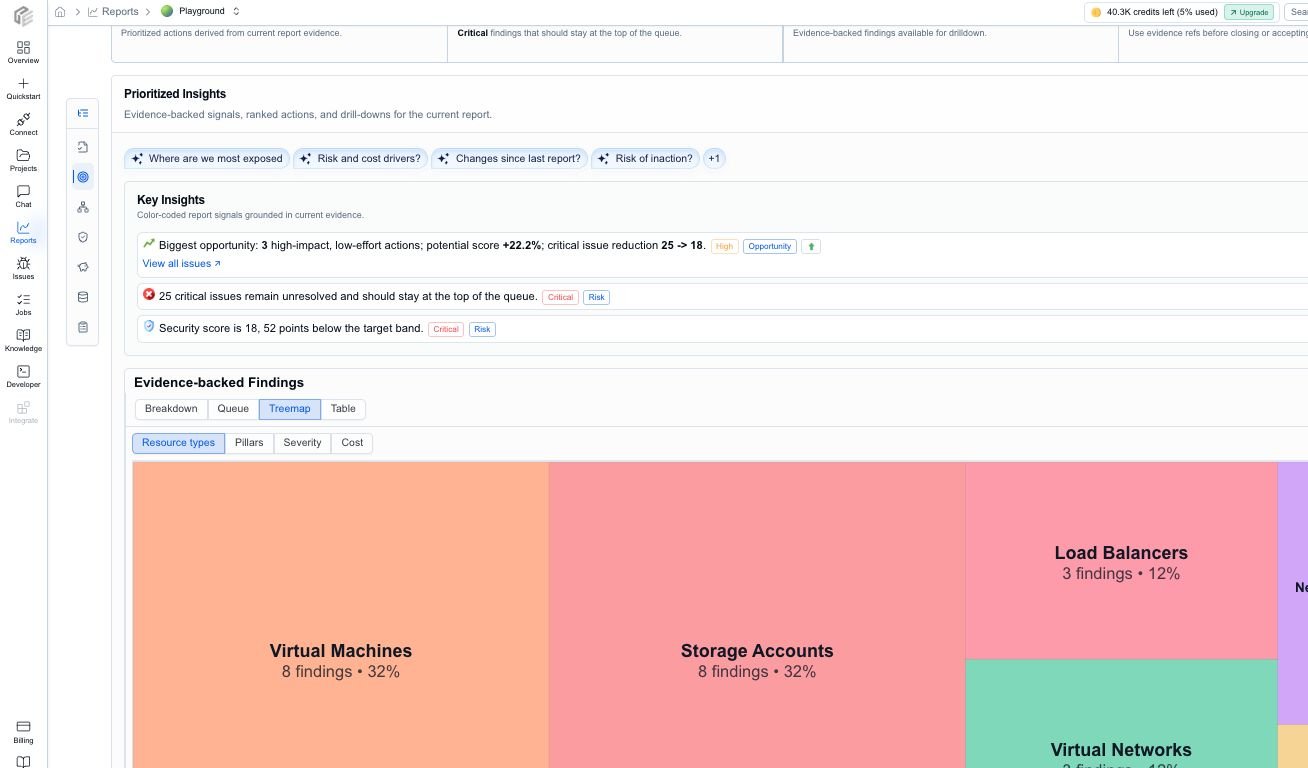
Use report breakdowns when a summary number is not enough. Change the mode, path, and filters to compare issues by project, pillar, category, severity, or resource type.
## Report payloads
CloudEval still generates and stores report payloads behind the unified report surface. The important distinction is:
* **Report payloads** are the generated data products, such as cost, architecture, and template or unit-test style results.
* **Report tabs** are the end-user review experience that combines those payloads with project context, evidence, confidence, inventory, and exports.
| Payload family | What it contributes to the report |
| ------------------------------------------------ | ---------------------------------------------------------------------------------------------------------------------------------------------------- |
| Cost | Run-rate cost, annualized context, savings opportunities, service-family breakdowns, region, currency, pricing assumptions, and unmatched resources. |
| Architecture and Well-Architected | Overall posture, pillar scores, architecture findings, dependency context, severity, affected resources, and design recommendations. |
| Unit-test or template validation where available | Template-focused pass/fail signals, import readiness, source-file references, and evidence for CI or pre-deployment review. |
## Cost and FinOps
Cost reporting is designed to answer:
* What does this project cost now?
* Where are the largest spending concentrations?
* Which opportunities are worth reviewing first?
* Which estimates have weak pricing coverage or missing usage context?
## Architecture and security
Architecture reporting is designed to answer:
* How healthy is this design overall?
* Which Well-Architected pillars need attention?
* Where are the critical and high-severity issues?
* Which resources or dependency paths carry the most risk?
Security and compliance review is part of the report experience when CloudEval has enough project evidence. Treat it as a risk and evidence review surface, not a compliance attestation or replacement for your formal audit process.
## Resources and evidence
The Resources tab connects report findings to the inventory that produced them. Use it when a stakeholder asks, "Which exact resource needs work?"
Resource rows can include:
* resource name, type, provider, region, subscription, resource group, and tags
* health or review status
* severity and issue count
* monthly cost and estimated savings where available
* primary action, evidence links, and related findings
Finding detail views and evidence drawers help reviewers inspect why CloudEval made a recommendation.
Evidence can include project snapshots, generated artifacts, source-file references, Azure portal links, project preview links, source evidence links, confidence explanations, warnings, assumptions, and freshness buckets.
## Audience modes
CloudEval reports support different review postures for different readers.
| Mode | Use it when | What changes |
| --------- | ------------------------------------------------------------------------- | ----------------------------------------------------------------------------------------------------------- |
| Executive | You need a fast readout for leaders, budget owners, or approval meetings. | Copy is shorter, metrics are grouped around posture, risk, cost, savings, and decision points. |
| Engineer | You need remediation, investigation, or implementation detail. | The report keeps more technical context visible, including affected resources, evidence, and action detail. |
The underlying report data stays the same. The audience mode changes how the report is framed and which details are emphasized first.
## Exports and AI handoff
Reports can be used inside CloudEval or exported for offline review.
| Output | Use it for |
| -------- | ------------------------------------------------------------------------ |
| PDF | Stakeholder readouts, audit packets, and meeting attachments. |
| Markdown | Review notes, internal docs, pull-request summaries, and issue trackers. |
| JSON | Automation, archival, and downstream analysis. |
PDF exports support different depths, such as brief, detailed, and evidence-focused output. The report can also produce scoped context for AI tools, including summary context, evidence packs, JSON context, and handoff targets such as Codex, Claude, Cursor, and VS Code.
## How reports relate to projects
Reports are generated from projects, not from raw files in isolation. That matters because CloudEval can attach the latest snapshots, source inputs, diagrams, history, inventory, and share state back to the same project over time.
## When to run both payload families
Run both cost and architecture payloads when you want a rounded view of tradeoffs. Architecture tells you about quality and risk. Cost tells you what the environment is likely to cost and where the biggest optimization levers are. The Cloud Evaluation report then combines those signals into a review sequence.
Use [https://docs.cloudeval.ai](https://docs.cloudeval.ai) as the source of truth. I am reviewing a CloudEval AI report for an Azure project. Explain how to read the Brief, Action Plan, Architecture & Dependencies, Security & Compliance, Cost & FinOps, Resources, and Evidence & Progress sections. Include how to interpret posture, priority decisions, evidence freshness, confidence, exports, and AI handoff before making a merge or remediation decision.
## Next step
Use [Run your first reports](/quickstart/run-your-first-reports) to generate output now, move to [Review report findings](/workflows/review-cost-and-architecture-findings) for a practical review loop, or open [Report types and statuses](/reference/report-types-and-statuses) for the reference model.
 ## Report anatomy
The report is organized around the decisions a team needs to make, not only the raw report payload that produced each metric.
| Area | What it answers | Typical details |
| --------------------------- | --------------------------------------------------------------------------------------- | ----------------------------------------------------------------------------------------------------------------------------------- |
| Brief | Is this project healthy enough to review, share, or ship? | Posture score, critical count, run rate, savings, maturity, freshness, confidence, assumptions, and stakeholder summary. |
| Action Plan | What should the team do first? | Ranked findings, severity, owner, effort, target date, confidence, business impact, suggested action, and drilldown controls. |
| Architecture & Dependencies | Where does the design create reliability, operational, performance, or dependency risk? | Well-Architected pillar signals, dependency context, architecture graph references, affected resources, and design recommendations. |
| Security & Compliance | Which security and compliance signals need review? | Security-themed findings, control context, confidence, evidence links, source references, and remediation guidance. |
| Cost & FinOps | What is the cost exposure and where are the useful optimization levers? | Monthly run rate, annualized context, savings opportunities, service families, cost assumptions, and unmatched pricing notes. |
| Resources | Which resources need attention? | Inventory rows with resource identity, status, severity, issue count, cost context, savings, evidence links, and primary action. |
| Evidence & Progress | Can the team trust the report and see what changed? | Source artifacts, warnings, assumptions, evidence links, freshness, trend snapshots, and report history where available. |
## Priority decisions
The first review pass should start with the issues that have the clearest severity, confidence, business impact, ROI, or effort signal. CloudEval keeps those signals together so the report is not just a long findings export.
## Report anatomy
The report is organized around the decisions a team needs to make, not only the raw report payload that produced each metric.
| Area | What it answers | Typical details |
| --------------------------- | --------------------------------------------------------------------------------------- | ----------------------------------------------------------------------------------------------------------------------------------- |
| Brief | Is this project healthy enough to review, share, or ship? | Posture score, critical count, run rate, savings, maturity, freshness, confidence, assumptions, and stakeholder summary. |
| Action Plan | What should the team do first? | Ranked findings, severity, owner, effort, target date, confidence, business impact, suggested action, and drilldown controls. |
| Architecture & Dependencies | Where does the design create reliability, operational, performance, or dependency risk? | Well-Architected pillar signals, dependency context, architecture graph references, affected resources, and design recommendations. |
| Security & Compliance | Which security and compliance signals need review? | Security-themed findings, control context, confidence, evidence links, source references, and remediation guidance. |
| Cost & FinOps | What is the cost exposure and where are the useful optimization levers? | Monthly run rate, annualized context, savings opportunities, service families, cost assumptions, and unmatched pricing notes. |
| Resources | Which resources need attention? | Inventory rows with resource identity, status, severity, issue count, cost context, savings, evidence links, and primary action. |
| Evidence & Progress | Can the team trust the report and see what changed? | Source artifacts, warnings, assumptions, evidence links, freshness, trend snapshots, and report history where available. |
## Priority decisions
The first review pass should start with the issues that have the clearest severity, confidence, business impact, ROI, or effort signal. CloudEval keeps those signals together so the report is not just a long findings export.
 Use the Action Plan when you need to:
* decide which issues block rollout
* separate urgent remediation from backlog work
* compare severity against savings and effort
* assign owners and target dates
* open a finding detail view without losing report context
## Breakdown views
Use report breakdowns when a summary number is not enough. Change the mode, path, and filters to compare issues by project, pillar, category, severity, or resource type.
Use the Action Plan when you need to:
* decide which issues block rollout
* separate urgent remediation from backlog work
* compare severity against savings and effort
* assign owners and target dates
* open a finding detail view without losing report context
## Breakdown views
Use report breakdowns when a summary number is not enough. Change the mode, path, and filters to compare issues by project, pillar, category, severity, or resource type.
 ## Report payloads
CloudEval still generates and stores report payloads behind the unified report surface. The important distinction is:
* **Report payloads** are the generated data products, such as cost, architecture, and template or unit-test style results.
* **Report tabs** are the end-user review experience that combines those payloads with project context, evidence, confidence, inventory, and exports.
| Payload family | What it contributes to the report |
| ------------------------------------------------ | ---------------------------------------------------------------------------------------------------------------------------------------------------- |
| Cost | Run-rate cost, annualized context, savings opportunities, service-family breakdowns, region, currency, pricing assumptions, and unmatched resources. |
| Architecture and Well-Architected | Overall posture, pillar scores, architecture findings, dependency context, severity, affected resources, and design recommendations. |
| Unit-test or template validation where available | Template-focused pass/fail signals, import readiness, source-file references, and evidence for CI or pre-deployment review. |
## Cost and FinOps
Cost reporting is designed to answer:
* What does this project cost now?
* Where are the largest spending concentrations?
* Which opportunities are worth reviewing first?
* Which estimates have weak pricing coverage or missing usage context?
## Report payloads
CloudEval still generates and stores report payloads behind the unified report surface. The important distinction is:
* **Report payloads** are the generated data products, such as cost, architecture, and template or unit-test style results.
* **Report tabs** are the end-user review experience that combines those payloads with project context, evidence, confidence, inventory, and exports.
| Payload family | What it contributes to the report |
| ------------------------------------------------ | ---------------------------------------------------------------------------------------------------------------------------------------------------- |
| Cost | Run-rate cost, annualized context, savings opportunities, service-family breakdowns, region, currency, pricing assumptions, and unmatched resources. |
| Architecture and Well-Architected | Overall posture, pillar scores, architecture findings, dependency context, severity, affected resources, and design recommendations. |
| Unit-test or template validation where available | Template-focused pass/fail signals, import readiness, source-file references, and evidence for CI or pre-deployment review. |
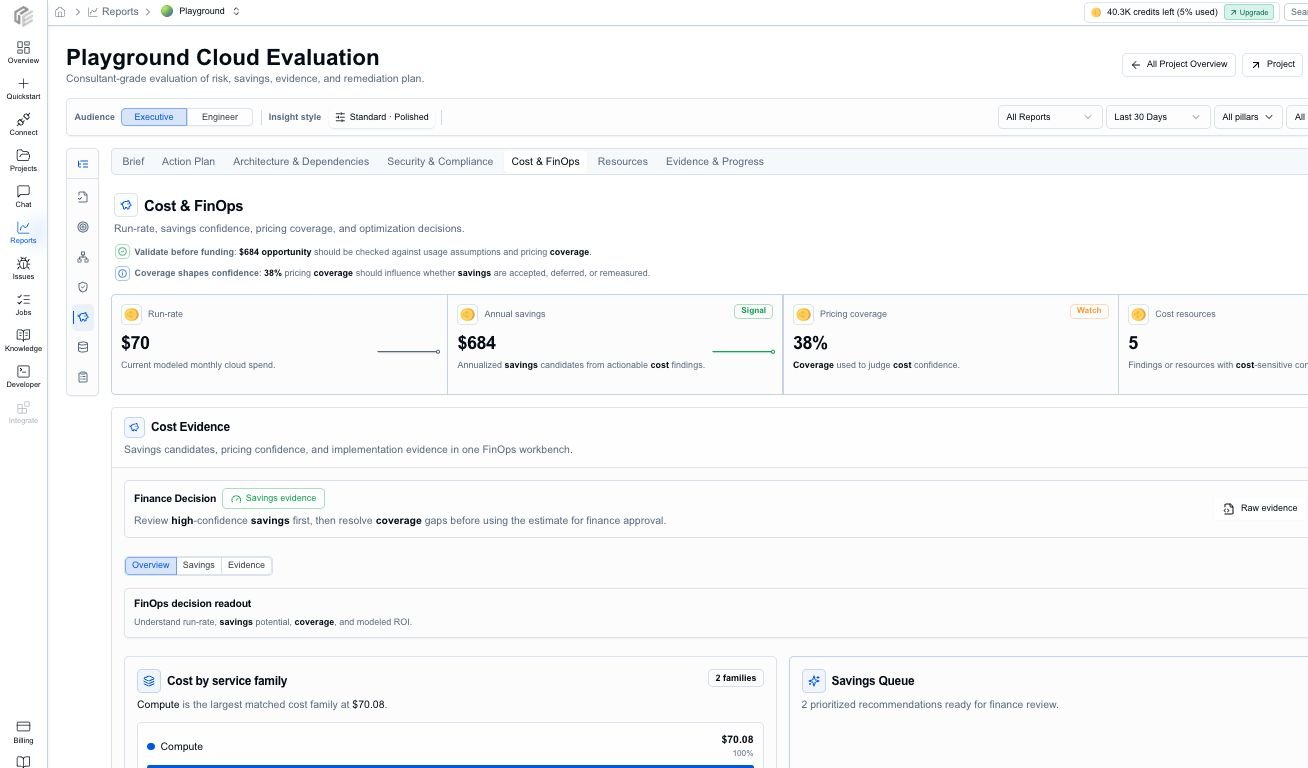
## Cost and FinOps
Cost reporting is designed to answer:
* What does this project cost now?
* Where are the largest spending concentrations?
* Which opportunities are worth reviewing first?
* Which estimates have weak pricing coverage or missing usage context?
 ## Architecture and security
Architecture reporting is designed to answer:
* How healthy is this design overall?
* Which Well-Architected pillars need attention?
* Where are the critical and high-severity issues?
* Which resources or dependency paths carry the most risk?
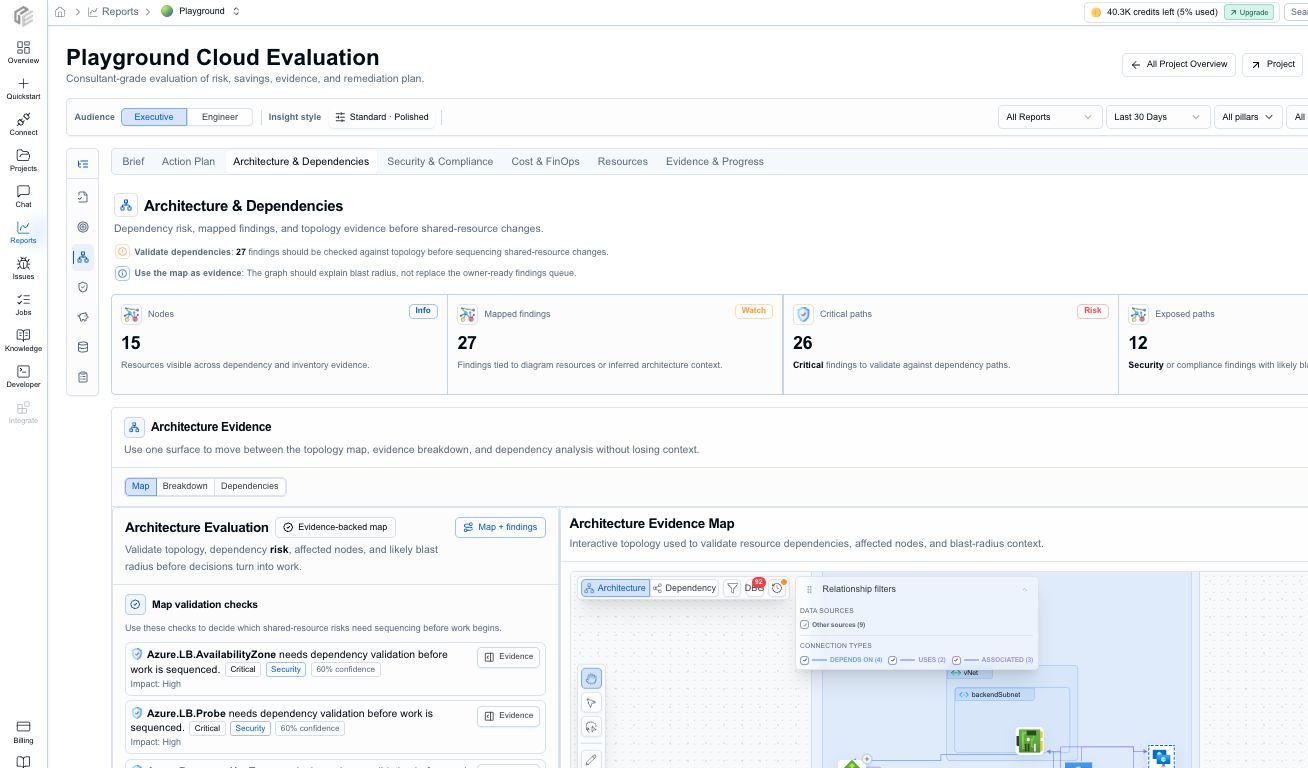
## Architecture and security
Architecture reporting is designed to answer:
* How healthy is this design overall?
* Which Well-Architected pillars need attention?
* Where are the critical and high-severity issues?
* Which resources or dependency paths carry the most risk?
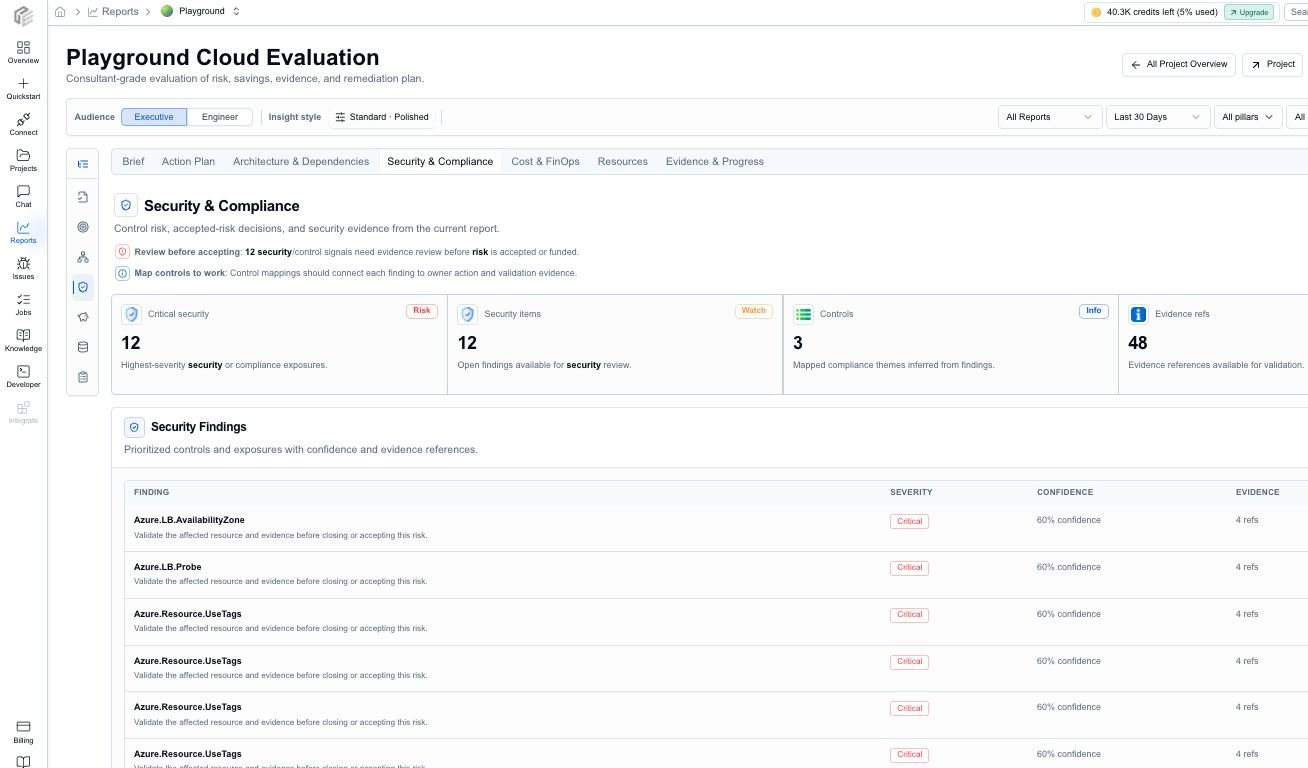
 Security and compliance review is part of the report experience when CloudEval has enough project evidence. Treat it as a risk and evidence review surface, not a compliance attestation or replacement for your formal audit process.
 ## Resources and evidence
The Resources tab connects report findings to the inventory that produced them. Use it when a stakeholder asks, "Which exact resource needs work?"
Resource rows can include:
* resource name, type, provider, region, subscription, resource group, and tags
* health or review status
* severity and issue count
* monthly cost and estimated savings where available
* primary action, evidence links, and related findings
Finding detail views and evidence drawers help reviewers inspect why CloudEval made a recommendation.
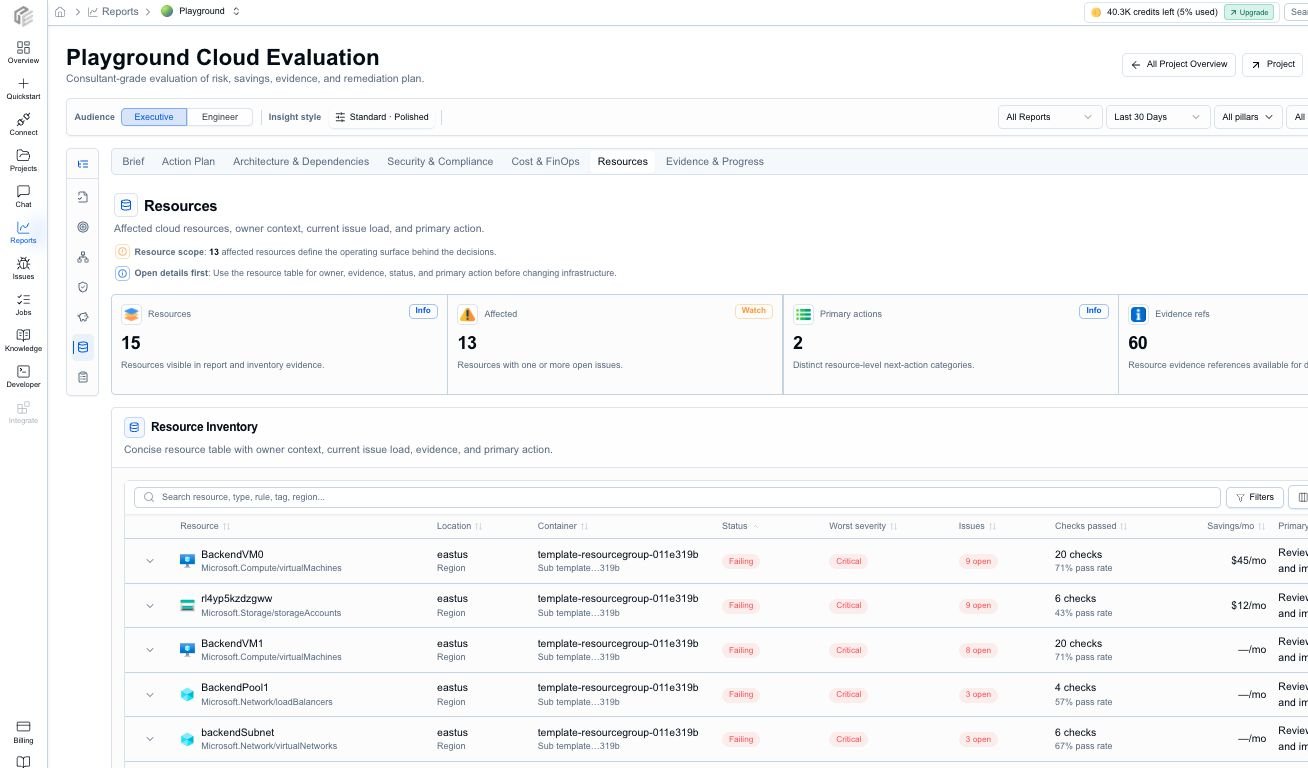
## Resources and evidence
The Resources tab connects report findings to the inventory that produced them. Use it when a stakeholder asks, "Which exact resource needs work?"
Resource rows can include:
* resource name, type, provider, region, subscription, resource group, and tags
* health or review status
* severity and issue count
* monthly cost and estimated savings where available
* primary action, evidence links, and related findings
Finding detail views and evidence drawers help reviewers inspect why CloudEval made a recommendation.
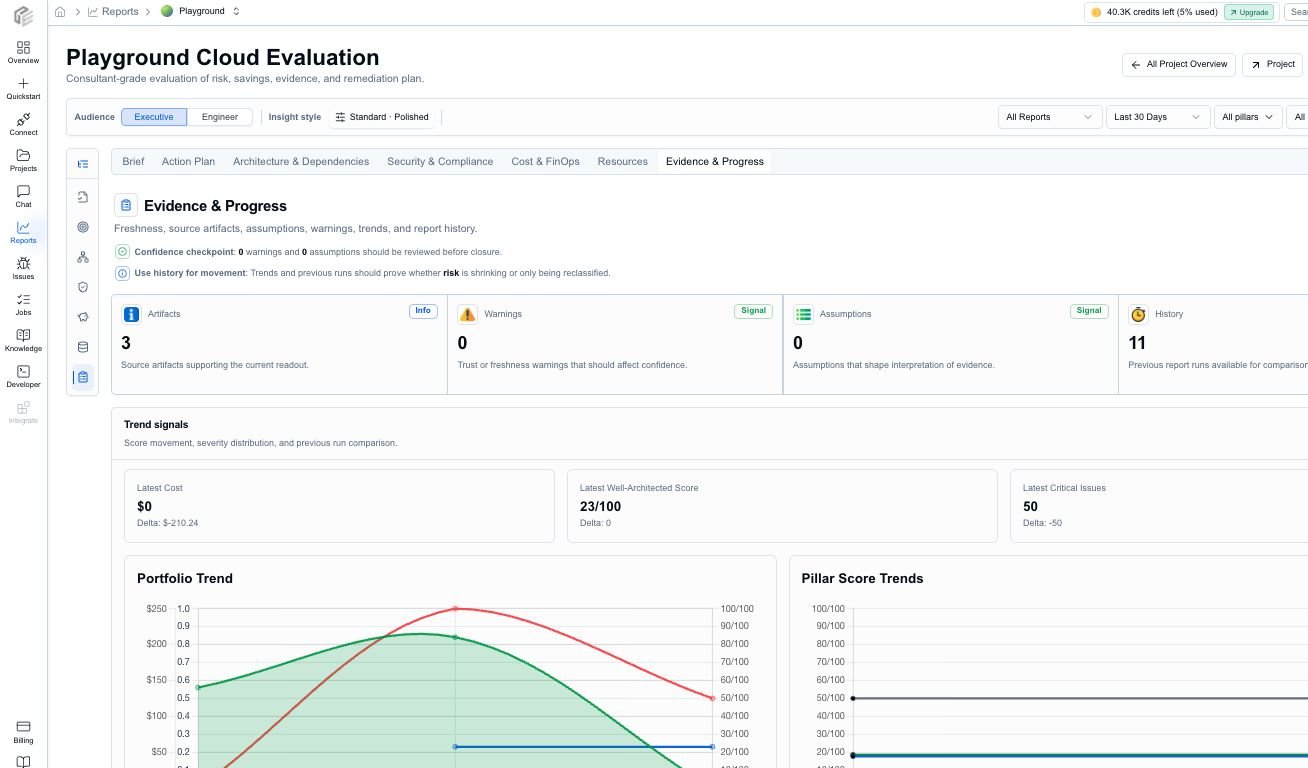 Evidence can include project snapshots, generated artifacts, source-file references, Azure portal links, project preview links, source evidence links, confidence explanations, warnings, assumptions, and freshness buckets.
## Audience modes
CloudEval reports support different review postures for different readers.
| Mode | Use it when | What changes |
| --------- | ------------------------------------------------------------------------- | ----------------------------------------------------------------------------------------------------------- |
| Executive | You need a fast readout for leaders, budget owners, or approval meetings. | Copy is shorter, metrics are grouped around posture, risk, cost, savings, and decision points. |
| Engineer | You need remediation, investigation, or implementation detail. | The report keeps more technical context visible, including affected resources, evidence, and action detail. |
The underlying report data stays the same. The audience mode changes how the report is framed and which details are emphasized first.
## Exports and AI handoff
Reports can be used inside CloudEval or exported for offline review.
| Output | Use it for |
| -------- | ------------------------------------------------------------------------ |
| PDF | Stakeholder readouts, audit packets, and meeting attachments. |
| Markdown | Review notes, internal docs, pull-request summaries, and issue trackers. |
| JSON | Automation, archival, and downstream analysis. |
PDF exports support different depths, such as brief, detailed, and evidence-focused output. The report can also produce scoped context for AI tools, including summary context, evidence packs, JSON context, and handoff targets such as Codex, Claude, Cursor, and VS Code.
## How reports relate to projects
Reports are generated from projects, not from raw files in isolation. That matters because CloudEval can attach the latest snapshots, source inputs, diagrams, history, inventory, and share state back to the same project over time.
## When to run both payload families
Run both cost and architecture payloads when you want a rounded view of tradeoffs. Architecture tells you about quality and risk. Cost tells you what the environment is likely to cost and where the biggest optimization levers are. The Cloud Evaluation report then combines those signals into a review sequence.
Evidence can include project snapshots, generated artifacts, source-file references, Azure portal links, project preview links, source evidence links, confidence explanations, warnings, assumptions, and freshness buckets.
## Audience modes
CloudEval reports support different review postures for different readers.
| Mode | Use it when | What changes |
| --------- | ------------------------------------------------------------------------- | ----------------------------------------------------------------------------------------------------------- |
| Executive | You need a fast readout for leaders, budget owners, or approval meetings. | Copy is shorter, metrics are grouped around posture, risk, cost, savings, and decision points. |
| Engineer | You need remediation, investigation, or implementation detail. | The report keeps more technical context visible, including affected resources, evidence, and action detail. |
The underlying report data stays the same. The audience mode changes how the report is framed and which details are emphasized first.
## Exports and AI handoff
Reports can be used inside CloudEval or exported for offline review.
| Output | Use it for |
| -------- | ------------------------------------------------------------------------ |
| PDF | Stakeholder readouts, audit packets, and meeting attachments. |
| Markdown | Review notes, internal docs, pull-request summaries, and issue trackers. |
| JSON | Automation, archival, and downstream analysis. |
PDF exports support different depths, such as brief, detailed, and evidence-focused output. The report can also produce scoped context for AI tools, including summary context, evidence packs, JSON context, and handoff targets such as Codex, Claude, Cursor, and VS Code.
## How reports relate to projects
Reports are generated from projects, not from raw files in isolation. That matters because CloudEval can attach the latest snapshots, source inputs, diagrams, history, inventory, and share state back to the same project over time.
## When to run both payload families
Run both cost and architecture payloads when you want a rounded view of tradeoffs. Architecture tells you about quality and risk. Cost tells you what the environment is likely to cost and where the biggest optimization levers are. The Cloud Evaluation report then combines those signals into a review sequence.